Fuente: ryandetrick.tumblr.com
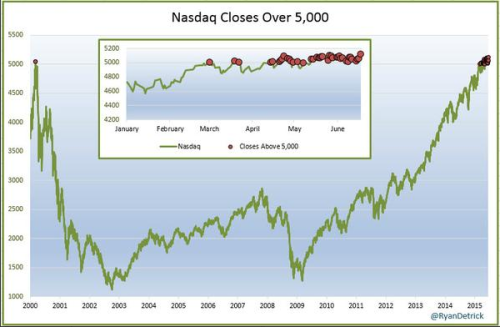
As you have probably heard by now, the Nasdaq closed at another new all-time high today. In fact, this is the 25th straight trading day it has closed above the 5,000 level. As you can see below, it closed above this level just twice in 2000 and it took 16 years to happen again.

Thanks to the release of the Consumer Price Index (CPI) data today via the Bureau of Labor Statistics (BLS) we can accurately show what the Nasdaq looks like in terms of today’s dollars. This is also known as adjusting for inflation. Much like the optical illusion picture at the top, doing this shows a much different angle than what most of us think of when we hear the Nasdaq is at new highs.
Adjusting the nominal price of the Nasdaq with the recent CPI data shows the real all-time closing high on March 10, 2000 was actually 7039.29, not 5048.62.

No hay comentarios:
Publicar un comentario