Fuente: Safehaven.com y Jordan Roy-Byrne


History makes a strong argument that this leg down in the miners is the final leg down.

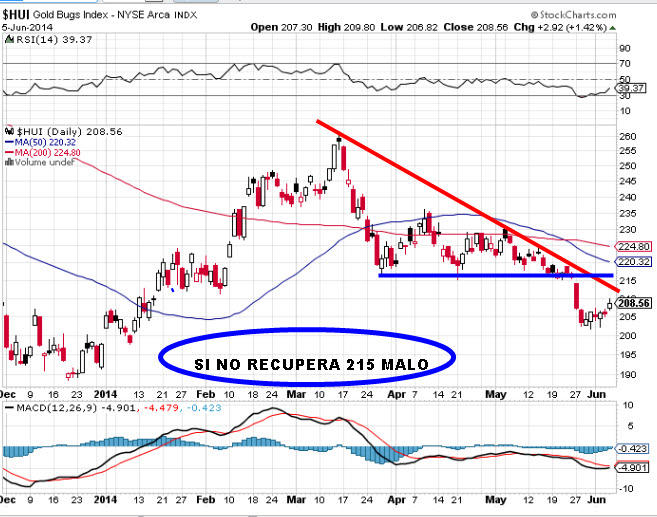
The bears analog chart argues that gold stocks could make a double bottom or perhaps a marginal new low. In my opinion, a new low would be a false new low. The next chart is a weekly plot of the HUI and GDM, the forerunner to GDX. The support (or buy) targets are quite clear.

No hay comentarios:
Publicar un comentario