Fuente: Ryan Detrick
The major buy signal no one is talking about
I like to look at various cycles in my work and one you’ve probably heard of is the Presidential cycle. This looks at what the S&P 500 (SPX) does every four years of a President’s term. In general, the second year (where we are now) of the cycle tends to be the worst and the third year tends to be the strongest. You’ve probably heard that many times before.
Well, we are currently in the second year of Obama’s second term. So really, this can also be looked at as year six of his term. Doing this shows much different results than what the average second year of all terms have done, as year six is actually extremely bullish.
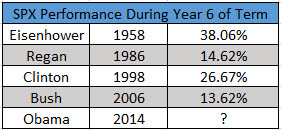
Here are all the sixth years of the Presidential cycles going back to 1950. Each one is positive and the average return is 23.24%.
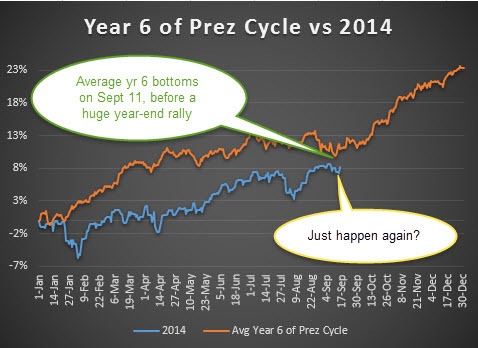
Now take a look at the chart. The average year six bottoms right around now and has a furious rally into the end of the year. Did history just repeat? Each data point on the orange line on the chart above presents the average for each day of the year from the years 1958, 1986, 1998, and 2006 (all sixth years of the Presidential cycle).
Lastly, please note that year six for Nixon would have been ‘74 (Ford) when the SPX dropped nearly 30%. Also year six for JFK would have been ‘66 (Johnson) when the SPX dropped nearly 20%. Including those years would have given much different results, but I’m only looking for returns of the same President in office during year six.
No hay comentarios:
Publicar un comentario