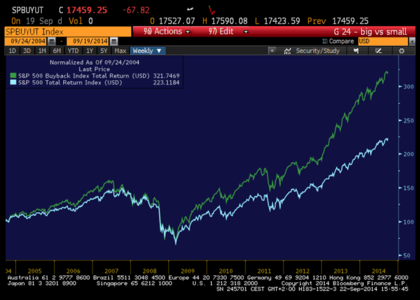
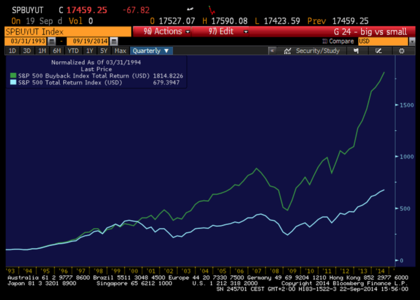
Fuente: Xavier Brun Inbestia.com

Rentabilidad últimos 10 años

Rentabilidad últimos 20 años

ETF QUE PERMITE ESTE TIPO DE INVERSION:
fuente: invesco.com
Este blog nació en enero de 2014. Se trata de una selección de artículos de inversión muy interesantes. Agradecemos el trabajo de los autores e intentamos su difusión.


| Large-Cap Value | 17.89% |
| Large-Cap Blend | 24.69% |
| Large-Cap Growth | 22.06% |
| Mid-Cap Value | 13.16% |
| Mid-Cap Blend | 8.90% |
| Mid-Cap Growth | 7.32% |
| Small-Cap Value | 1.73% |
| Small-Cap Blend | 3.20% |
| Small-Cap Growth | 1.07% |
Ticker
|
Company
|
% of Fund
|
|---|---|---|
| HD | Home Depot Inc/The | 5.69 |
| PFE | Pfizer Inc | 4.97 |
| T | AT&T Inc | 4.95 |
| ORCL | Oracle Corp | 4.77 |
| HAL | Halliburton Co | 3.26 |
| GM | GENERAL MOTORS CO | 3.12 |
| LOW | Lowe's Cos Inc | 3.11 |
| DTV | DIRECTV | 2.56 |
| YHOO | Yahoo! Inc | 2.40 |
| TWC | Time Warner Cable Inc | 2.37 |
No hay comentarios:
Publicar un comentario