viernes, 8 de agosto de 2014

Biotecnología por las nubes


Viendo este gráfico, la verdad que lo primero que hace uno es tragar saliba.Vaya pendiente de subida...


Gráfico: Inbestia.com


Nueva oportunidad bajista en Biotecnología USA, gráfico técnico 1 2014-07-16

Publicado el 28 de marzo en capitalbolsa.com, análisis de Goldman Sachs.


ANALISIS TÉCNICO, por Renta 4 Banco


Nueva oportunidad bajista en Biotecnología USA, gráfico técnico 6 2014-07-16


Si queremos posicionarnos cortos al 200% (No es posible al 100%), RENTA 4 comercializa un ETF:  BIS

jueves, 7 de agosto de 2014

Primark ¿la nueva Inditex?


Fuente: Wikipedia.org


Primark es una cadena irlandesa de tiendas que pertenece al grupo Associated British Foods. La empresa está especializada en ropa y complementos a precios bajos. La mayoría de prendas que venden se fabrican exclusivamente para el grupo, pero también se comercializan prendas fuera de temporada de otras marcas.
En 1969 se abrió la primera tienda del grupo en la calle Mary Street de Dublín, que recibió el nombre de Penneys. En menos de un año se inauguraron cuatro tiendas más en el área de la capital irlandesa, y en 1971 se abrió el primer local en la ciudad de Cork. Dos años después, el grupo llegó a Reino Unido como Primark, donde fue expandiéndose con el paso de los años. En 2000 Primark aprovechó la retirada de C&A del mercado británico para adquirir sus locales, lo que le ayudó a superar los 100 establecimientos.
Desde 2006 Primark ha iniciado un plan de expansión internacional en el continente europeo, que comenzó con la inauguración de una tienda en un centro comercial en Madrid (España). En 2009, la compañía también ha abierto negocios en Portugal,Países Bajos, Alemania y Bélgica.3 Actualmente, el nombre comercial Penneys se utiliza sólo en la República de Irlanda, mientras que en el resto de países se llama Primark.
En 2009 el fundador Arthur Ryan abandonó la compañía, por lo que el grupo emprendió una renovación en todos sus cargos directivos.


La City especula con la salida a Bolsa de Primark

Fuente: expansion.com  artículo febrero 2014


Los analistas de Morgan Stanley en Londres creen que la cadena de tiendas irlandesa podría valer en diez años tanto como el grupo español Inditex.

Primark, que opera 269 tiendas de ropa en 9 países europeos (frente a las más de 6.000 de Inditex), es propiedad al 100% de Associated British Food (ABF), grupo cotizado en Londres que tiene otras filiales como la española Azucarera.

"Estamos de acuerdo con la valoración que hace el mercado de la mayor parte de los activos de ABF, pero estamos cada vez más convencidos de que los inversores menosprecian Primark", dice Morgan Stanley en un informe enviado esta semana a sus clientes.
Esta nota ha elevado la especulación que existe en la City financiera de Londres sobre la posibilidad de que ABF saque a bolsa su filial de tiendas mediante la venta de una participación, algo que la familia Weston (primer accionista del grupo) descarta por ahora. Como consecuencia de estos rumores, las acciones de ABF suben un 17% desde comienzos de año.

Según Audrey Borius-Gunning, autor principal del informe de Morgan Stanley, Primark "puede valer ahora 30.000 millones de libras (36.000 millones de euros) si se compara con los múltiplos a los que cotizan Inditex y H&M en bolsa".

La capitalización de ABF no recoge ese precio por Primark, ya que todo el grupo vale unos 23.000 millones de libras en bolsa. "Los inversores siempre han minusvalorado a las empresas de distribución, y parecen seguir haciéndolo", dice Morgan Stanley.
A su juicio, Primark se ha embarcado en un proceso de desarrollo y crecimiento muy rápido, similar al de Inditex durante las últimas décadas. "La mejor estrategia para los inversores en el sector ha sido comprar empresas con veinte años de crecimiento de espacio comercial superior al 10% anual".

Los analistas estiman que Primark podría llegar a las 400 tiendas en 2018 en Europa occidental, casi el doble que ahora. En la Península Ibérica, por ejemplo, pasaría de 41 a 92 establecimientos. En ese periodo, Morgan Stanley calcula que las ventas comparables subirán a un ritmo de un 4% anual y la superficie de venta un 14% anual".

Gracias a ese desarrollo, "dentro de diez años, Primark será al menos tan valioso como H&M e Inditex en la actualidad". Ello implicaría llegar a una capitalización cercana a los 70.000 millones.
Aunque Primark tiene muchas menos tiendas que Inditex, los analistas de Morgan Stanley resaltan que la filial de ABF factura una cantidad superior por cada metro cuadrado de espacio. "Las ventas de Primark y su superficie comercial son comparables ahora a Inditex en 2003-2004, pero su densidad de ventas fue un 20% superior a la de Inditex en 2013 y será un 30% superior en 2014. Esto refleja la competitividad del modelo de Primark", concluye el análisis.


RESULTADOS HASTA 1 DE MARZO:

Fuente: dailymail.co.uk


Budget retail chain Primark has seen its profits soar by 26 per cent to £298 million in just six months.(364 millones de euros)

The move pushed sales up 14 per cent to £2.278 billion (2.779 mill eur) in the 24 weeks leading up to March 1 while its operating margin increased by 13.1 per cent. 

There are now 269 Primark stores covering nearly 10 million square feet of selling space across nine European countries - with the company now hoping to launch in the U.S.


It plans to open a 70,000 square-foot store in Boston next year with negotiations under way to open further stores in the north east of the country in 2016.
The new store in Boston will be in the Burnham Building, which is currently being renovated, at Downtown Crossing, in the heart of the city. The site was previously home to Boston's famous Filene's department store.


The retailer said: 'Primark has a strong consumer following in nine countries in Western Europe.  After extensive research it has been decided to take the concept to consumers in the USA.'
The United States has been a notoriously tricky market for UK retailers to crack, with Tesco and Marks & Spencer among those to experience failure.
But the company is hopeful the brand will be as successful in the U.S. as it has been in Europe. 
Primark's expansion in the UK has been focused on increasing selling space in major cities, with the opening of its second store in London's Oxford Street and extensions to shops in Newcastle and Manchester.

It expects to add more than a million square feet of space in the current financial year, having opened its first stores in France in Marseille and Dijon. Three new UK stores in the second half include a relocation in Cardiff.

The chain's profit announcement comes days after the anniversary of the collapse of an nine-storey factory in Dhaka, Bangladesh, where Primark clothes were being made. 
The collapse of Rana Plaza on April 24 last year claimed the lives of 1,100 people making it retail’s worst industrial accident ever.
It also highlighted the issue of where Britain’s cheap clothes are made and the conditions and safety of the workers involved.
Bonmarche and Matalan were also found to be using workers in the building at the time of the collapse. 
Many other British retailers were suspected to have used suppliers in the same facility in the period leading up to the collapse.
ABF has now started paying $9million (£5.34million) in long-term compensation to the affected.


GRAFICO DE LA EMPRESA PROPIETARIA DEL 100% DE PRIMARK

Associated British Foods plc


martes, 5 de agosto de 2014

EEUU: Todos somos bajistas, así se sube....


Fuente: Ryan Detrick


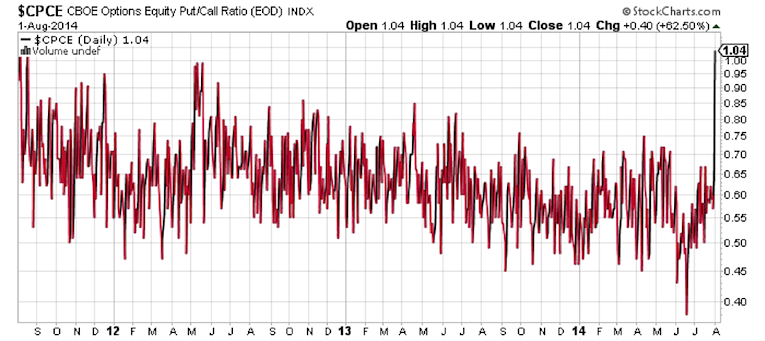
Friday saw some extreme readings in sentiment, which brings the question is there enough fear out there to form a major low?
For starters, the CBOE options equity put/call ratio spiked clear up to 1.04 on Friday.  As I discussed here, this is the highest level in three years and 19th highest reading since 2003.  Remember, when everyone is trading bearish puts that could be a sign of extreme fear in the options market.  From a contrarian point of view, that could be a bullish sign.  

cboe equity put call ratio spike august 2014


The ISE Sentiment Index saw similar action, as its proprietary call/put ratio registered the second lowest reading ever!  This ratio looks at just customers opening long positions, so it is a fairly true gauge for the overall action.  Again, this ratio was very low, which suggests buying puts over calls was near historic levels.  


Now what throws a real wrench into the whole thing is there were rumors some of those trades on Friday weren’t legit and were ‘fat finger’ trades.  Reuters summed it up here, but as of now the trades appear they’ll count.  They just might need to have a big asterisk next to them.  

Más gráficos de EEUU


Fuente: Francisco Toledo. Inbestia.com


El spread actual entré el Dow Jones y el Smart Money Flow Index es muy parecido al que había en 2000 y 2007. Por supuesto que continua la divergencia bajista entre ellos desde mayo de 2013.

078916b8910ee6a6b7935e786f2885b44f125078


Triángulo expansivo en DOW JONES.
La zona de congestión en el tercer vértice del triángulo no termina de romper al alza, por tanto la teoría del triángulo expansivo sigue en standby.
e0fcbfa7a7b5d1eb144a7a607718d8db6dcbf246


lunes, 4 de agosto de 2014

EEUU: Un gráfico que asusta


Fuente: Ryan Detrick

One Chart That Scares Me
Back on June 26, I noted the One Chart That Scares Me - the CBOE options equity put/call ratio.  Then I gave another update two weeks ago and noted it looked scarier actually.  Well, here’s another update and things are the same, I still think this says weakness is coming.
Below was the chart I used back in late June.  As I said at the time, as long as it is trending lower, this is bullish.  The big concern was how low things had gotten.  In other words, how potentially complacent options traders had become.  A move higher from these low levels could produce some troubles for the bulls - as this ratio tends to trend inversely with the equity prices.  


Rewind back to two weeks ago and the ratio had finally turned higher.  What was a concern was now a full-fledged worry.  Also the Russell 2000 (RUT) made a potential double top.  Both of those were clues some near-term weakness was likely to happen.  Here’s the chart from two weeks ago.  

What’s it look like now?  The RUT has totally broken down, the SPX finally cracked some yesterday and the put/call ratio is firmly pointing higher with no signs of a change in trend anytime soon.  As long as this ratio is going higher, I’d be more defensive.  

This isn’t the end of the world and I still think we should have a nice second half of the year when all is said and done,  but between sentiment getting a little too frothy, seasonality a big worry, and the chart above - I think it pays to be very open to further weakness the next few months.  
Thanks for reading.  
Photo by Elisa Perusin
 
Photo by: Elisa Perusin


As long as it is trending lower, this is bullish.  The big concern was how low things had gotten. In other words, how potentially complacent options traders had become.  A move higher from these low levels could produce some troubles for the bulls - as this ratio tends to trend inversely with the equity prices.  


image

EEUU: Agosto no suele ser un buen mes para invertir


Fuente: Christopher Mistal & Jeffrey A. Hirsch


First Nine Trading Days of August Are Historically Weak 


August Is Worst Performing $DIA $SPY $QQQ $IWM Month Since 1988

Money flows from harvesting made August a great stock market month in the first half of the Twentieth Century. It was the best month from 1901 to 1951. In 1900, 37.5% of the population was farming. Now that less than 2% farm, August is amongst the worst months of the year. It is the worst DJIA and S&P 500 month since 1987 with average declines of 1.3% and 1.0% respectively. August is also the worst month for NASDAQ (–0.3%) and Russell 2000 (–0.7%) over the same time period. 

Contributing to this poor performance since 1987; the shortest bear market in history (45 days) caused by turmoil in Russia, the Asian currency crisis and the Long-Term Capital Management hedge fund debacle ending August 31, 1998 with the DJIA shedding 6.4% that day. DJIA dropped a record 1344.22 points for the month, off 15.1%—which is the second worst monthly percentage DJIA loss since 1950. Saddam Hussein triggered a 10.0% slide in August 1990. The best DJIA gains occurred in 1982 (11.5%) and 1984 (9.8%) as bear markets ended. Sizeable back-to-back declines in 2010 and 2011 have widened Augusts’ average losses. 

In midterm years since 1950, Augusts’ rankings improve slightly: #10 DJIA, #9 S&P 500, #12 NASDAQ (since 1974), #8 Russell 1000 and #11 Russell 2000 (since 1982). Average losses range from 0.6% for Russell 1000 to 2.8% for Russell 2000. DJIA suffered double-digit losses in 1974, 1990 and 1998. 


"If the market does not rally, as it should during bullish seasonal periods, it is a sign that other forces are stronger and that when the seasonal period ends those forces will really have their say."
—Edson Gould (Stock market analyst, Findings & Forecasts, 1902-1987)

No estamos en techo de mercado


Fuente: Inbestia.com


¿Estamos ante un techo mayor de mercado y fin de ciclo alcista? En nuestra opinión, no. Hay determinados segmentos de mercado donde sí observamos una absoluta ausencia de estructura en primas de riesgo y tensiones muy importantes en valoración. Pero no es generalizado. Hay mercados y segmentos con valoraciones razonables. Los techos mayores de mercados se suelen desarrollar con un ciclo económico, empresarial y de crédito más avanzado. Creemos que todavía queda una última fase de mercado alcista en algunos activos de riesgo. Esa fase en la que se observa una correlación positiva entre tipos de interés (subiendo) y cotizaciones bursátiles (subiendo).
¿Cuándo empezamos a subir peso en RV? Cuando se de alguna de estas dos condiciones. 
(1) GdC Tactical Asset Allocation en +60% o superior (hoy en +32%). Recordamos que esta herramienta se apoya en diferentes medidas de valoración de los mercados de acciones (absolutas y relativas frente a TIR deuda pública) y del análisis del sentimiento de mercado.
(2) Alerta alcista GdC. Esta se activará cuando el modelo econométrico detecte un potencial igual o superior al +10% en Eurostoxx. Hoy está en el +1,6% (viene del -12% hace unos meses). Las variables que afectan al modelo son (a) pendiente curva EURIBOR 3meses – Deuda Alemana 10 años, (b) diferencia entre la rentabilidad por dividendo y Deuda Alemana 10 años y (c) el ratio precio / valor contable.
¿Y si nos equivocamos? En ese caso siempre recordamos las palabras de Howard Marks “Es más importante asegurar que se puede sobrevivir si se dan entornos negativos que garantizar que se  va a obtener el máximo retorno en entornos favorables”. Por lo tanto, prudencia, humildad, metodología y disciplina.


Imagen

No seamos tan negativos


Fuente: Bankinter


El mercado se sofistica y puede parecer algo confuso, pero no sólo no es algo que deba preocuparnos seriamente, sino que seguramente se demostrará que es más bien sano para su sostenibilidad en el medio
plazo.

La reunión del BCE del jueves debería ofrecer un perfil bajo. Por eso pensamos que el desenlace más probable es una estabilización progresiva. Es mucho mejor así, que en una versión más agresiva. Mejor esto que un mercado (bolsas) en rally con poco volúmen este verano. Eso aumentaría la probabilidad de una corrección visceral posterior. Es decir, es mejor que el mercado se enfríe y avance con dificultades y lento ahora que entramos en pleno verano y los volúmenes caen porque si afloraran argumentos que forzaran la
continuidad de las subidas (bolsas) éstas podrían terminar siendo imprudentemente bruscas debido a la erraticidad que suele acompañar a volúmenes reducidos.

Las resistencias técnicas que enfrentan las bolsas implican romper nuevos máximos históricos en el caso
americano - Wall Street marca tendencia para el resto - y eso no es fácil de superar. Llevará tiempo, pero sucederá. Dejemos algo de ilusión para el 4T. Por eso conviene no preocuparse demasiado, teniendo
constantemente presente que el mercado debe continuar disfrutando de un ciclo expansivo aún incipiente, de resultados empresariales mejorando (BPA 2T del S&P 500 +10,8% vs +5,2% estimado, con 372
compañías publicadas, p.ej.), de financiación fácil y muy barata, sin riesgos inflacionistas, etc.

Conviene no olvidar que el "nuevo dinero fresco" del BCE (los TLTROs) aún no se ha inyectado: la primera
entrega tendrá lugar en septiembre y la segunda en diciembre... y podría haber más. Eso forzará la entrega de crédito bajo criterios de riesgo más relajados, de manera que la reacción inducida sobre la actividad económica en Europa podría resultar tan brusca que hace temer las consecuencias de una hipotética "sobreestimulación crediticia". Todo eso no ha llegado aún, pero está muy cerca. Por eso seguimos defendiendo que estos momentos de debilidad pasajera deben interpretarse como valiosas oportunidades para continuar construyendo cartera de cara al nuevo ciclo expansivo. Incluso la reacción del inmobiliario en España está siendo ya más brusca de lo esperado... aunque esta sensación aún no se haya "popularizado".

sábado, 2 de agosto de 2014

A largo plazo aún somos alcistas

Fuente: rastreandovalor


A veces lo más fácil funciona muy bien.Si nos fijamos en estos gráficos mensuales, si el precio respeta la media de 15 meses, no hay problema.
Nos estamos acercando a ellas y, queda casi todo el mes de Agosto por delante.Así que aún somos alcistas, pero con precaución.


DAX 30


IBEX 35


DOW JONES


NASDAQ 100


EUROSTOXX 50

En este caso la media de 200 meses lleva años ejerciendo de resistencia perfectamente.


Los gráficos muestran peligro


Fuente: Eduardo Faus, Miguel Pareja.


IBEX 35

Enlace permanente de imagen incrustada


FTSE 100 LONDRES

Enlace permanente de imagen incrustada


DAX MENSUAL

Cotizando fuera del canal alcista mensual


Enlace permanente de imagen incrustada


Enlace permanente de imagen incrustada