lunes, 12 de noviembre de 2018
domingo, 11 de noviembre de 2018
Buffett no siempre acierta

In last 52 years of Berkshire, Buffett has underperformed S&P 500 during 17 years. Even if Buffett underperforms one third of the time, be kind to yourself and other investors. Still Buffett has outperformed S&P 500 by 10% over 5 decades. Always look for long term averages.
D.Muthukrishnan
SP500: cuesta mantenerse dentro
La estancia media de las compañías cotizadas en el índice S&P 500, según un informe realizado por la consultora Innosight. En 1965, la media de permanencia era de 33 años, mientras que, en 1990, ya se había reducido a 20 años y, en 2012, a 18. De hecho, el informe de Innosight apunta a que, en 2026, la permanencia media en el S&P 500 habrá bajado a los 14 años.
S&P 500: la mitad de empresas que en el año 2000
Lo cierto es que, de las empresas que había en el índice en el año 2000, hoy solo permanecen la mitad. Es decir, la tasa de renovación de las empresas se ha ido acelerando a medida que las nuevas tecnologías y los nuevos hábitos de consumo han ido ganando terreno. Al final, solo están las mejores empresas, aquellas que han sabido redefinirse, adaptarse y seguir creciendo, así como las que han entrado a sustituir a las compañías salientes.
Recordemos que el comité encargado de seleccionar las empresas del S&P 500 analiza el mérito de las mismas utilizando ocho criterios primarios:
-capitalización bursátil,
-liquidez,
-domicilio,
-capital flotante,
-clasificación del sector,
-viabilidad financiera,
-periodo de tiempo durante el cual ha cotizado en bolsa y
-ser negociada en la bolsa de valores.
En definitiva, las empresas tienen un ciclo de vida cada vez más corto y solo se mantienen y crecen aquellas que no paran de innovar.
Fuente: Eurekers.com

viernes, 9 de noviembre de 2018
índice CRB de materias primas: ¿Le queda una caída del 35%?
@hks55
Commodities have one last flush leg lower that will mark the end of the China commodity super cycle and will coincide with China deleveraging/Yuan deval EM bear market. $OIL will fall below $20

MEDIASET ESP: mucho castigo para ¿un buen balance?
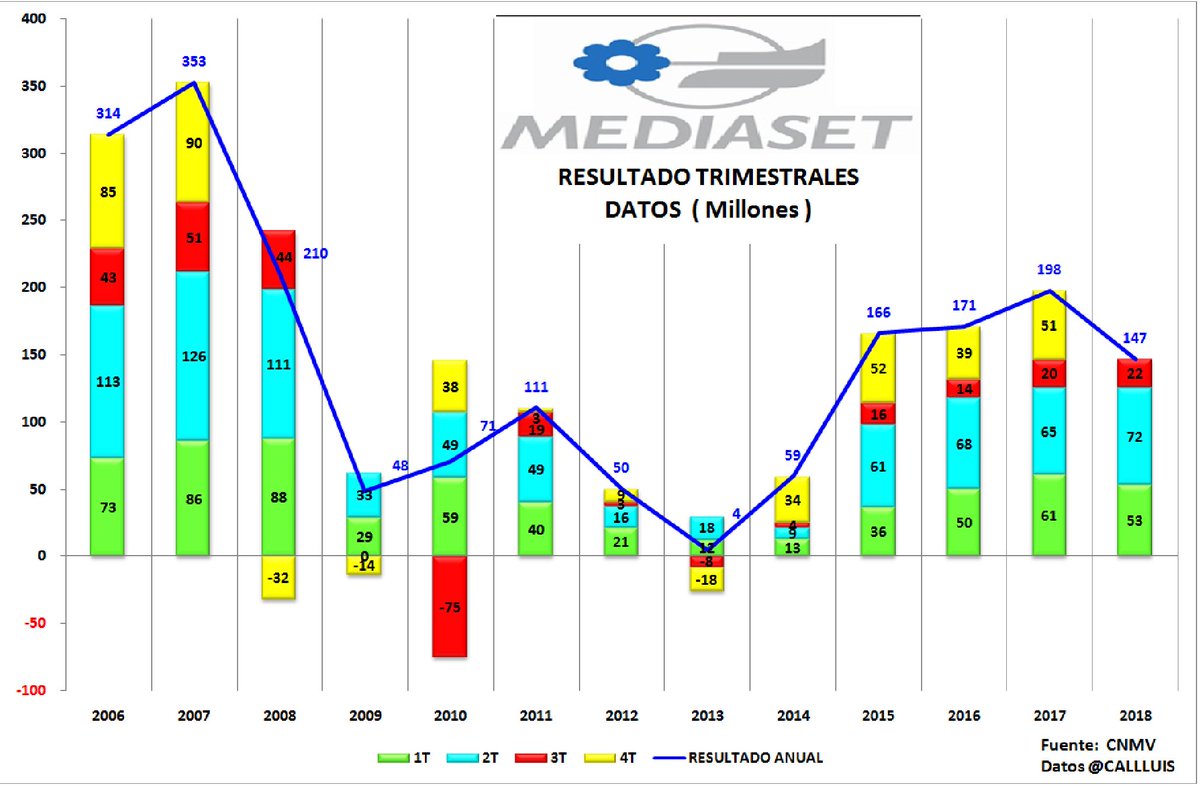
Análisis fundamental realizado por Renta4 Banco:
www.r4.com/analisis-actualidad/Mediaset-Espana-3T18-El-EBITDA-supera-ampliamente-Nueva-rebaja-Guia?id=519794
Análisis técnico:

invertiryespecular.com
viernes, 2 de noviembre de 2018
Cash each company has:
Apple: $237.1 billion
Microsoft: $135.9 billion
Google: $106.4 billion
Samsung: $82.9 billion
Oracle: $60.1 billion
Cisco: $46.5 billion
Facebook: $41.2 billion
Amazon: $29.8 billion
Total: $740 billion
Fuente: Jon Erlichman
SP500: ¿Cómo se comporta cuando corrige?
Fuente: Ben Carlson
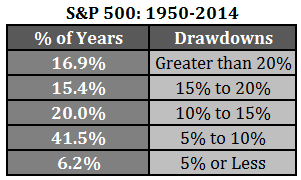
Going back to 1928…
When stocks fell 10%:
- 44.7% of the time they didn’t fall any further than 15%
- 12.8% of the time they didn’t fall any further than 20%
- 17.0% of the time they fell between 20% and 30%
- 10.6% of the time they fell between 30% and 40%
- 8.5% of the time they fell between 40% and 50%
- 6.4% of the time they fell more than 50%
When stocks fell 15%:
- 23.1% of the time they didn’t fall any further than 20%
- 30.8% of the time they fell between 20% and 30%
- 19.2% of the time they fell between 30% and 40%
- 15.4% of the time they fell between 40% and 50%
- 11.5% of the time they fell more than 50%
When stocks fell 20%:
- 40.0% of the time they didn’t fall any further than 30%
- 25.0% of the time they fell between 30% and 40%
- 20.0% of the time they fell between 40% and 50%
- 15.0% of the time they fell more than 50%
When stocks fell 30%:
- 41.7% of the time they didn’t fall any further than 40%
- 33.3% of the time they fell between 40% and 50%
- 25.0% of the time they fell more than 50%
When stocks fell 40%:
- 57.1% of the time they didn’t fall any further than 50%
- 42.9% of the time they fell more than 50%
When stocks fell 50%:
- 66.7% of the time they didn’t fall any further than 60%
- 33.3% of the time they fell more than 60%
So roughly 60% of the time a 10% correction didn’t lead to a bear market while roughly 40% of the time it did.

Suscribirse a:
Entradas (Atom)