Fuente: Zerohedge.com Jose Luis Cárpatos
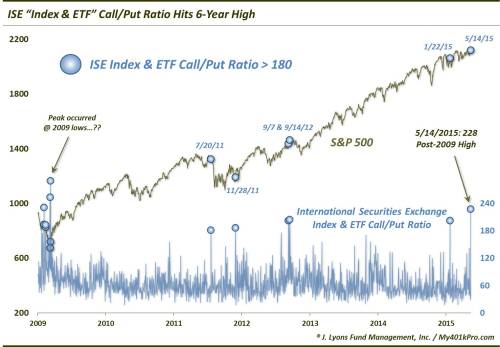
The ISE Index & ETF Call/Put Ratio registered its highest reading (228) in over 6 years.
At 228, the reading means that call volume at the ISE was more than double put volume. In the last 6 years, that is just the 4th time that has occurred. These are the dates of all of the readings above 180 since 2009, along with the aftermath in the S&P 500.
- July 20, 2011 The S&P 500 hit a high the following day before dropping 16% over 12 days.
- November 28, 2011 The exception as the S&P 500 was jumping off a short-term low and would rally 6% over the next week.
- September 7 & 14, 2012 The S&P 500 hit a high on the 14th and proceeded to drop nearly 8% in the next 2 months.
- January 22, 2015 The S&P 500 hit a high that day before dropping 3.3% over 6 days.
Over the past 4 years, the ISE Index & ETF Call/Put Ratio has typically been a contrarian indicator, when at extremes. Thus, yesterday’s most bullish reading in 6 years is likely not a welcomed sign for stock market bulls.

No hay comentarios:
Publicar un comentario