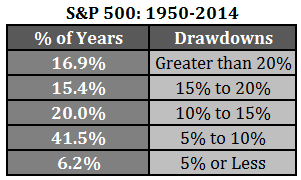
Fuente: Ben Carlson

Going back to 1928…
When stocks fell 10%:
- 44.7% of the time they didn’t fall any further than 15%
- 12.8% of the time they didn’t fall any further than 20%
- 17.0% of the time they fell between 20% and 30%
- 10.6% of the time they fell between 30% and 40%
- 8.5% of the time they fell between 40% and 50%
- 6.4% of the time they fell more than 50%
When stocks fell 15%:
- 23.1% of the time they didn’t fall any further than 20%
- 30.8% of the time they fell between 20% and 30%
- 19.2% of the time they fell between 30% and 40%
- 15.4% of the time they fell between 40% and 50%
- 11.5% of the time they fell more than 50%
When stocks fell 20%:
- 40.0% of the time they didn’t fall any further than 30%
- 25.0% of the time they fell between 30% and 40%
- 20.0% of the time they fell between 40% and 50%
- 15.0% of the time they fell more than 50%
When stocks fell 30%:
- 41.7% of the time they didn’t fall any further than 40%
- 33.3% of the time they fell between 40% and 50%
- 25.0% of the time they fell more than 50%
When stocks fell 40%:
- 57.1% of the time they didn’t fall any further than 50%
- 42.9% of the time they fell more than 50%
When stocks fell 50%:
- 66.7% of the time they didn’t fall any further than 60%
- 33.3% of the time they fell more than 60%
So roughly 60% of the time a 10% correction didn’t lead to a bear market while roughly 40% of the time it did.
No hay comentarios:
Publicar un comentario