martes, 25 de diciembre de 2018

lunes, 17 de diciembre de 2018

ETF: OIH en mínimos de muchos años


  El problema es que no podemos invertir en ETFs americanos.

   OIH : US listed companies involved in oil services to the upstream oil sector, which include oil equipment, oil services, or oil drilling.


jueves, 13 de diciembre de 2018

Cruces de medias muy peligrosos


Fuente: Bespoke

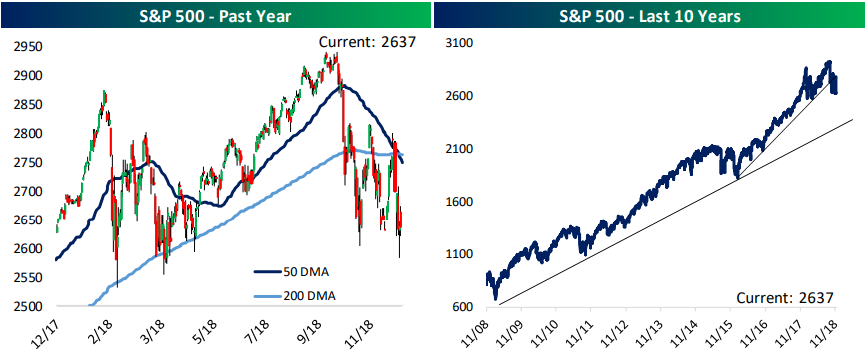
The S&P 500 (U.S.) has so far managed to hold above support at 2,600, while its 10-year chart still looks relatively bullish.

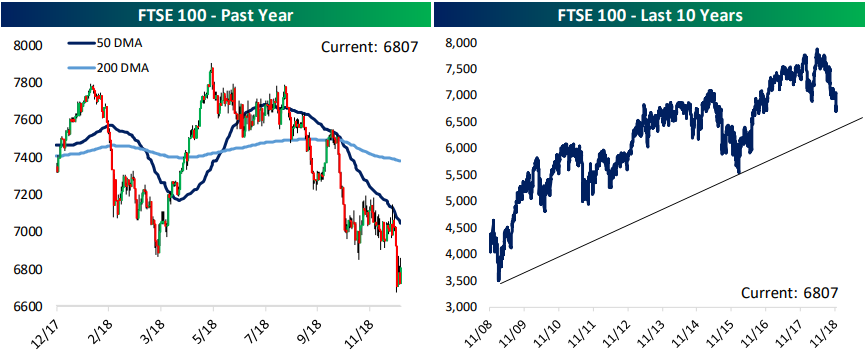
The FTSE 100 (UK) is in a nasty multi-month downtrend with a recent break to new 52-week lows, but price has still yet to test the bottom of its 10-year uptrend channel.

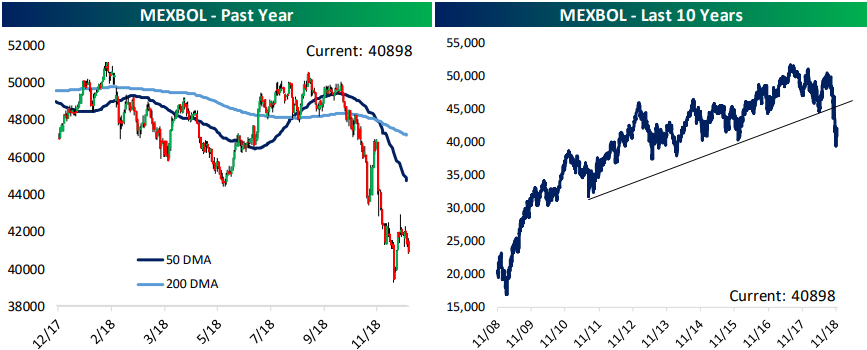
Mexico’s Bolsa index has plummeted 20% from its recent highs, and this drop also broke a key support level on its 10-year chart as well.

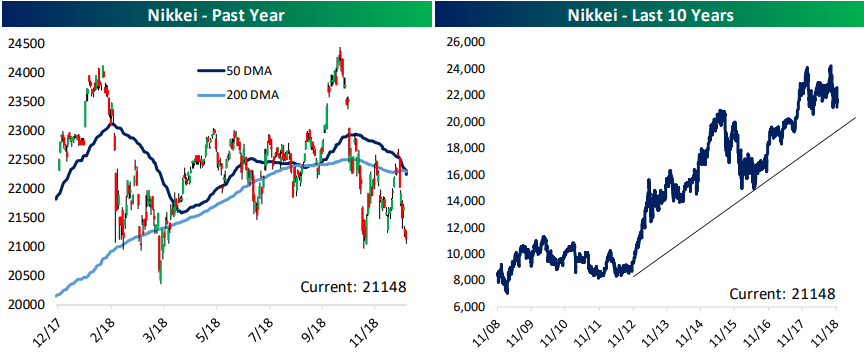
Japan’s Nikkei 225 looks somewhat similar to the chart for the S&P 500.  The index has been choppy over the last year but hasn’t made a new 52-week low, and it remains well within its 10-year uptrend channel.

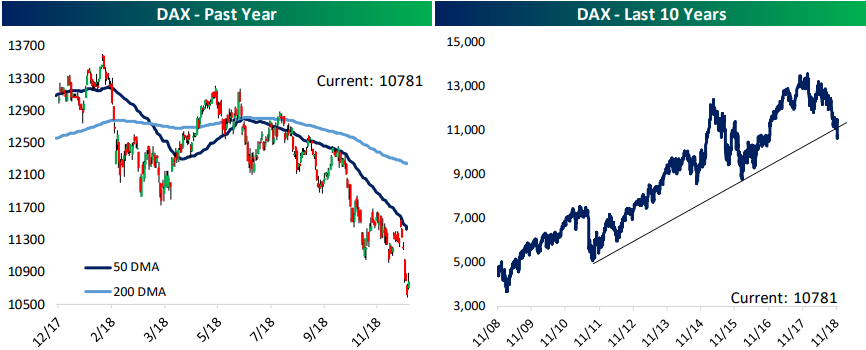
The German DAX index looks very negative on both a short-term and long-term technical basis.  As shown, the index is a falling knife on the one-year chart, and it just broke below its long-term uptrend channel on the 10-year chart.

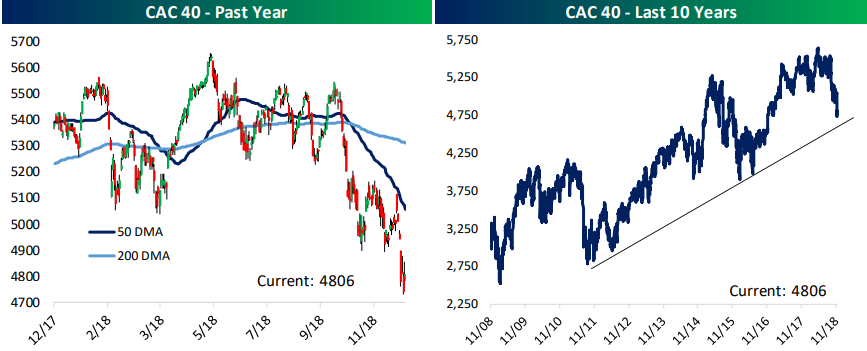
While Germany’s DAX has broken down on a 10-year chart, France’s CAC 40 remains slightly above the bottom of its long-term uptrend channel.

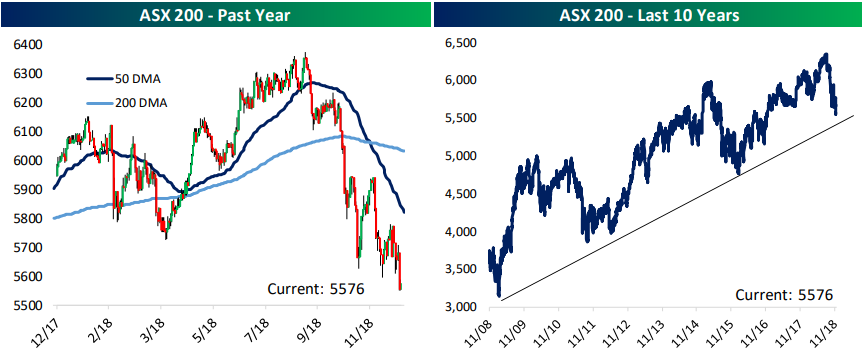
Like the French CAC 40, Australia’s ASX 200 has recently made a 52-week low, but it remains above the bottom of its 10-year uptrend channel.

martes, 11 de diciembre de 2018

El fondo JPM Global income cumple 10 años


US High Yield27,60%Securitized Debt4,70%
Global Equity15,10%Emerging Markets Equity4,20%
Preferred Equity9,20%Emerging Markets Debt2,10%
US Agency Mortgages8,50%convertible bonds2,00%
European High Yield7,20%Cash8,00%
Global REITs5,90%Total100,00%
European Equity5,50%
a: 31.10.2018

Rentabilidad (a: 31.10.2018)

 1 mes3 meses1 año3 años5 añosDesde el lanzamiento
Fondo-2,72%-3,14%-3,69%5,60%14,20%107,05%
Índice de referencia-3,52%-2,67%-1,57%14,11%24,68%145,86%
Rentabilidad adicional0,83%-0,48%-2,16%-7,46%-8,41%-15,79%
Fecha de lanzamiento:11 diciembre 2008
Fuente: J.P. Morgan Asset Management.
Los datos de rentabilidad son los valores liquidativos (NAV to NAV) con reinversión de rentas brutas.

domingo, 9 de diciembre de 2018

Wall Street cada vez pondera más


11 compañías controlan todo el mercado


Fuente: zerohedge
Quizás faltan dos más en esa lista:

-Diageo 


-Danone

Villavicencio Agua Salus (se exporta para Brasil como Agua del Puma), 
Aguas de Lanjarón, 
Fontvella, 
Volvic, 
Evian, 
Badoit, 
Lattella, 
Actimel,
Activia,
Bonafont,
Danonino,
Vitalinea,
Danacol,
Mi Primer Danone,
Oikos,
Densia,
Savia.

Wall Street: las recompras son "peligrosas"


Los investigadores han demostrado que los ejecutivos utilizan las “buybacks” para crear una demanda temporal adicional de acciones lo que aumenta el precio de las acciones a corto plazo a medida que los ejecutivos proceden a las ventas de sus carteras personales.


Fuente: Andrés Llorente